
Key Insights: Supply Chain, Economy, and Trends
This post delves into various important topics, from nearshoring in supply chains to the 2024 election and economic indicators. Discover the latest insights and trends shaping our world.
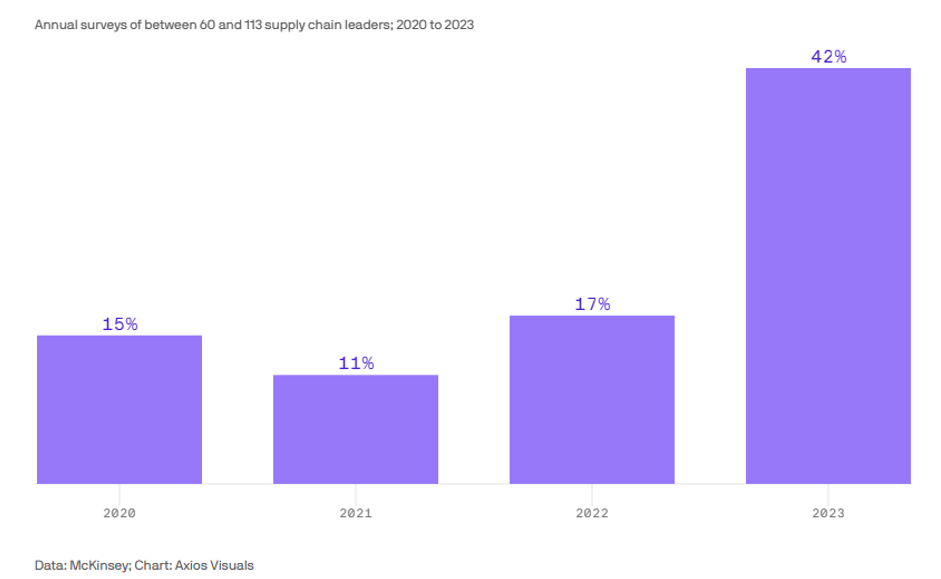
Nearshoring: Closing in on Success
Nearshoring, which involves moving production closer to the end consumer, has become an increasing priority as many executives aim to prepare for the unexpected.
Below is the percentage of supply chain leaders who report that their company has taken action to nearshore production.
Delivering the Top Twenty
The Top 20 Logistics Corridors in the United States.

Supply Chain Index Dropped: Downward Trend
The GEP Global Supply Chain Index fell to -0.50 in July from -0.26 in June. This indicates an increase in excess capacity across global supply chains due to weak global demand conditions and ongoing warehouse destocking.

Oil Prices: Upward Trajectory Ahead
The EIA forecasts that crude oil prices will continue to rise through 2024.

Diversifying the Shipping Shuffle
Yellow's bankruptcy led to an 8% decrease in carrier diversification as shippers opted to shift their freight to existing logistics partners instead of onboarding new carriers.

Warehouse Rates Soaring High
The cost of occupying prime warehouses rose by 10% in the year through June. London, the most expensive city, commands the highest price at $41.68 per square foot, followed by Sydney at $27.44, ranking second.

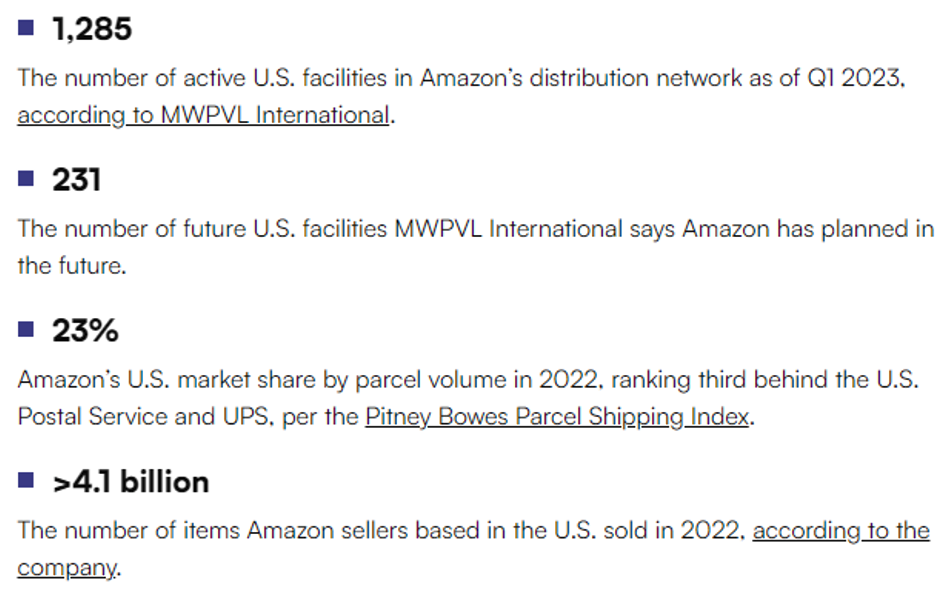
Prime Disruption in Delivery
Amazon's Impact on the Parcel Delivery Industry: By the Numbers
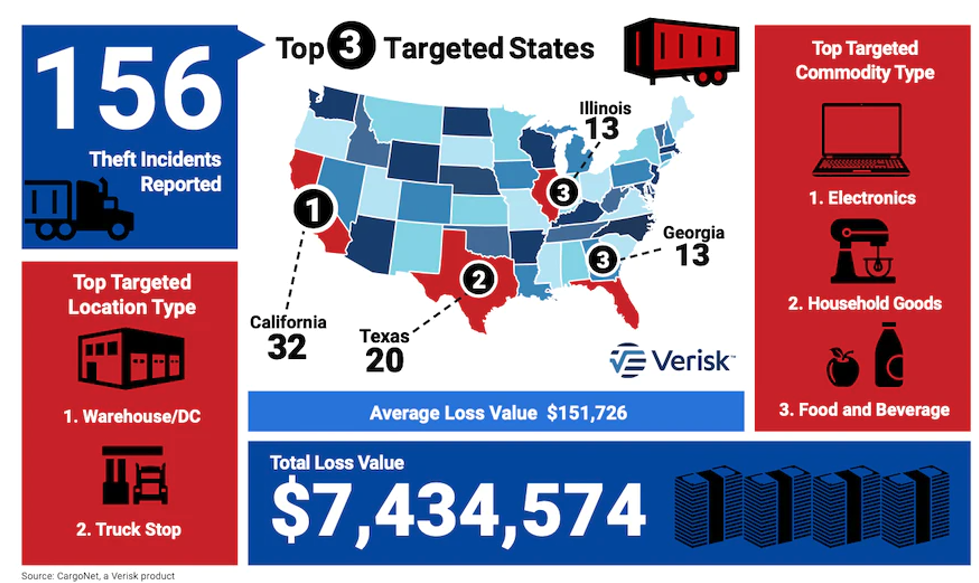
Cargo Theft Surge for Labor Day
With increased cargo thefts this year, an expected Labor Day spike.
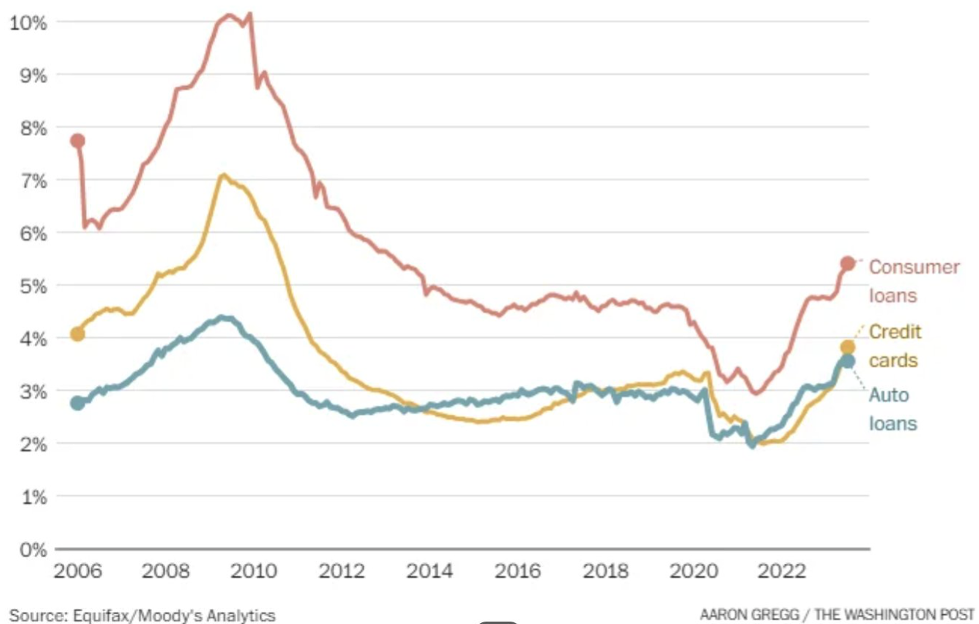
Loan Woes on the Rise
Delinquencies on car loans, credit cards, and consumer loans have reached their highest levels in a decade.
Election Age Gauge
Age may be the biggest factor in the 2024 election – nearly the same percentage of Democrats think Biden and Trump are too old to effectively serve another 4-year term.

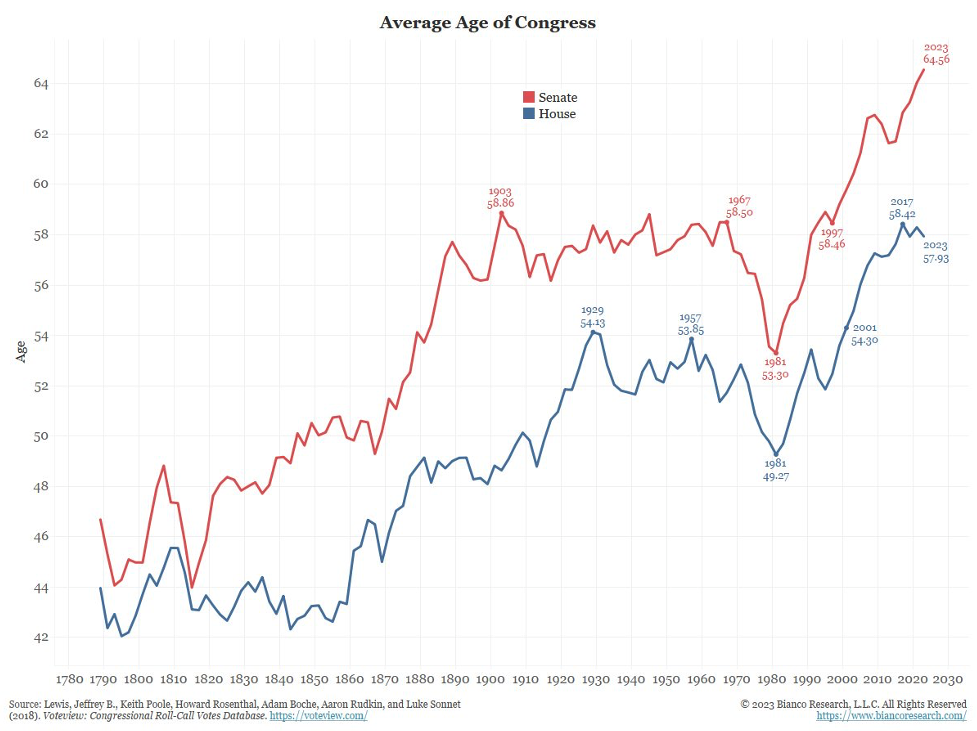
Age of Congress: Stats Unveiled
The average age of a Senator is 64.56 years old, while the average age of a House member is 57.93 years old. Since 1980, both averages have seen significant increases.
Savings Rate Slips: July's Dive
The nation's personal saving rate dropped from 4.3% in June to 3.5% in July.

Party Lines on Unions
Approval of Labor Unions by Party Identification Trends.

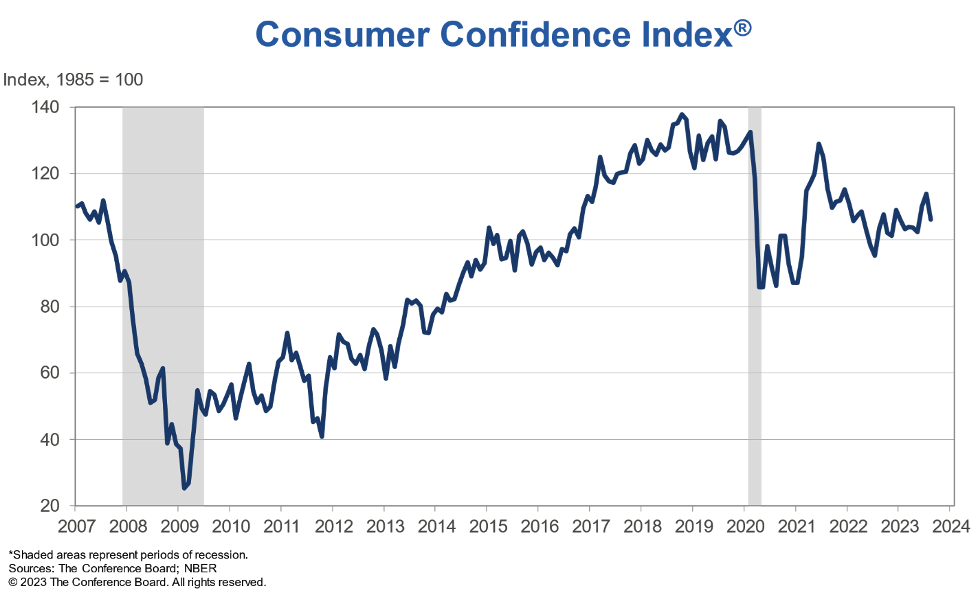
Confidence Dips: August Wobble
U.S. consumer confidence pulled back slightly in August.


Manifest 2024 served as a reminder of the immense potential that lies ahead in the realm of supply chain technology.