
Insights and Trends: A Comprehensive Review of Current U.S. Statistics and Perceptions
Inflation Blame Game: Corporate Scapegoats
Sixty-one percent of U.S. adults believe profit-hunting corporations deserve "a lot" of blame for inflation, up from 52% in 2022. This exceeds the percentage who blame spending by the federal government, the price of foreign oil, the war in Ukraine, or the level of consumer demand.

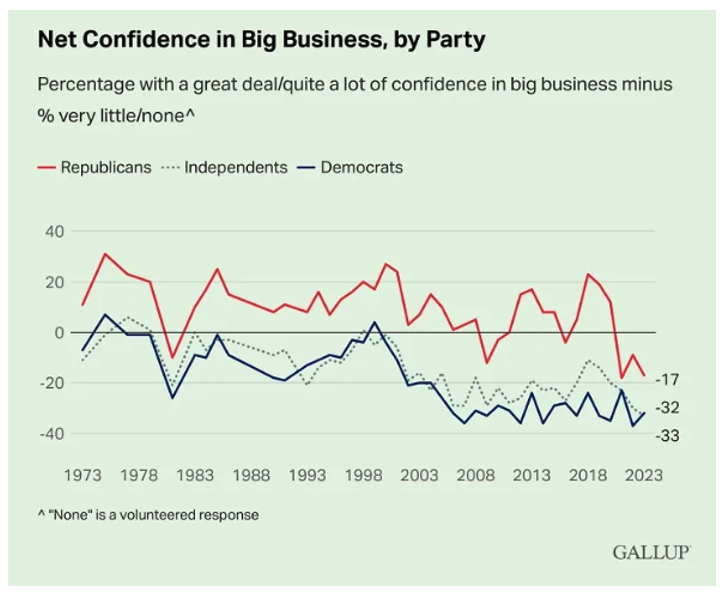
Republicans and Big Biz
After decades when Republicans routinely viewed big business in a more positive light, their perspective shifted in 2021 and remains notably negative today.
Cost Crash: Goods Go Cheaper
Six goods and services that are cheaper today than they were a year ago.

U.S. Emissions: Lightly Green
The U.S. remains among the least emission-intensive countries in the world. In 2021, the U.S. emissions intensity levels were 3 times lower than China, 4 times lower than India, and nearly 5 times lower than the former Soviet Union.

China's Popularity Dips Waning
Negative views of China have become increasingly common in recent years. And now, Americans see China as the greatest threat facing the nation.

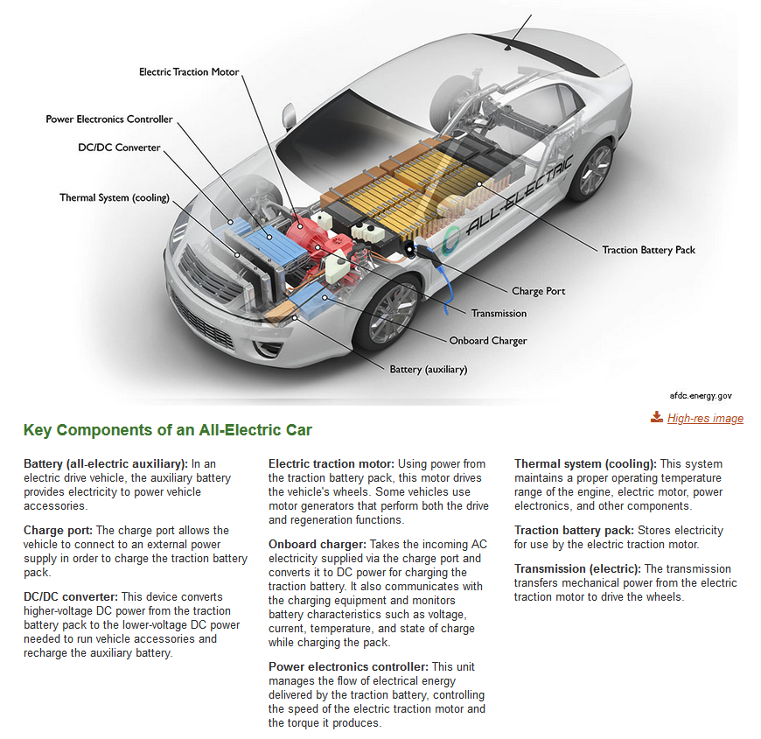
EV-olution: Sparks of Progress
How do EVs work? To compare with plug-in hybrid, hybrid electric, hydrogen fuel cell, and gasoline vehicles, click here.
Home Work Perks
Top benefits of working from home: Commuting time saves, on average, about 1 hour a day. Gas and meal costs save about $20.

Tonnage Tiptoes, Recession's Shadow
The truck tonnage index increased 2.1% in June but remains in recession territory.

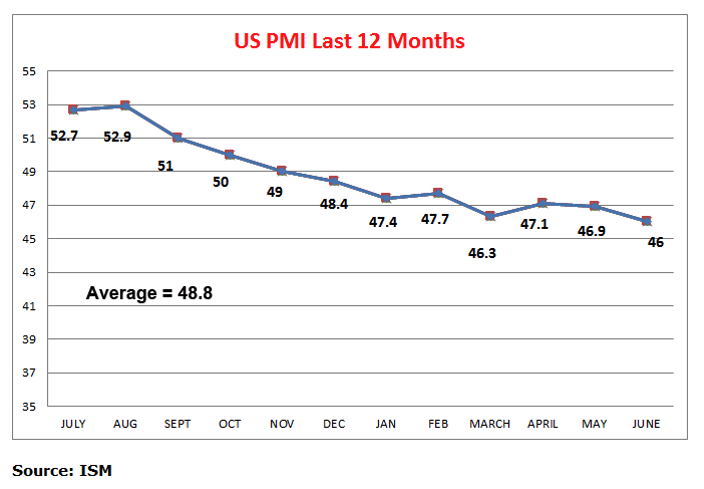
Purchasing Power in Doldrums!
The U.S. Purchasing Manager Index has been below the 50 mark for 9 straight months. Fifty is the dividing line between U.S. manufacturing expansion and contraction.
Trumping the Odds: 2024 Bet
Political betting markets think it's Trump for the Republican nomination in 2024.

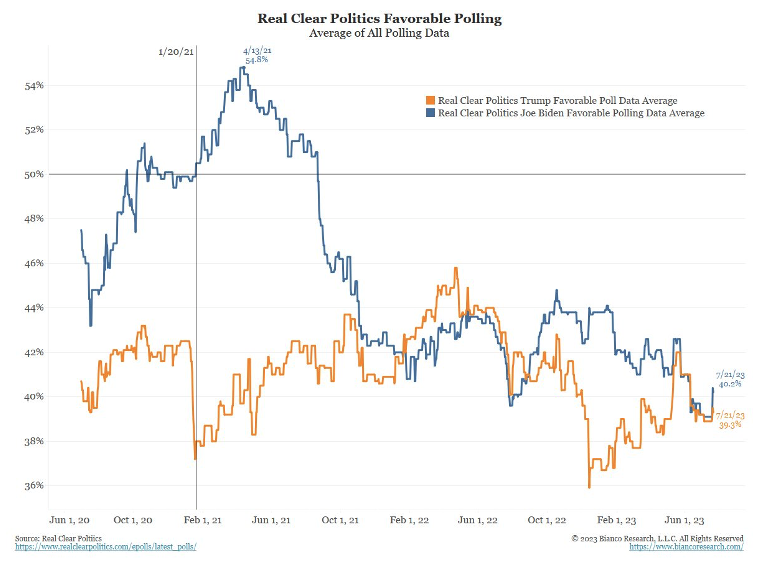
Rating Replay: Biden and Trump
After Biden's initial honeymoon period in early 2021, his presidential approval ratings appear much like Trump's.
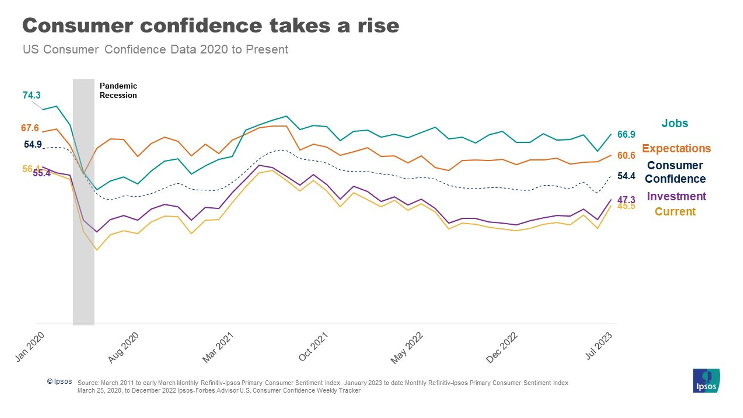
Chillflation: Consumer Confidence Surges
A recession has not emerged, and inflation seems to be cooling down. And now, consumers are growing more confident.
Heated Summer Records Sizzle
This summer's average global temperatures are higher than in previous years.

Youthful Wheels Idle
Teenagers and 20-somethings are driving less. The main reasons are resources, money, and time to access a car – and recently, the pandemic.

Footpath Phobia
As a form of traveling, Americans clearly don't like walking. And they also have notably unfavorable views of traveling by bus, taxi, and subway.

Auto Theft Surge
Car theft rates per 100k residents are historically high.

Dairy Queen Reigns
Dairy Queen is the most dominant ice cream chain in about 3 out of 4 US counties.

Holly-wouldn't You Know?
Finally, it seems like Hollywood is back on track. Notice the massive drop in box office returns during the pandemic years and the slow climb back, including Barbie/Oppenheimer.


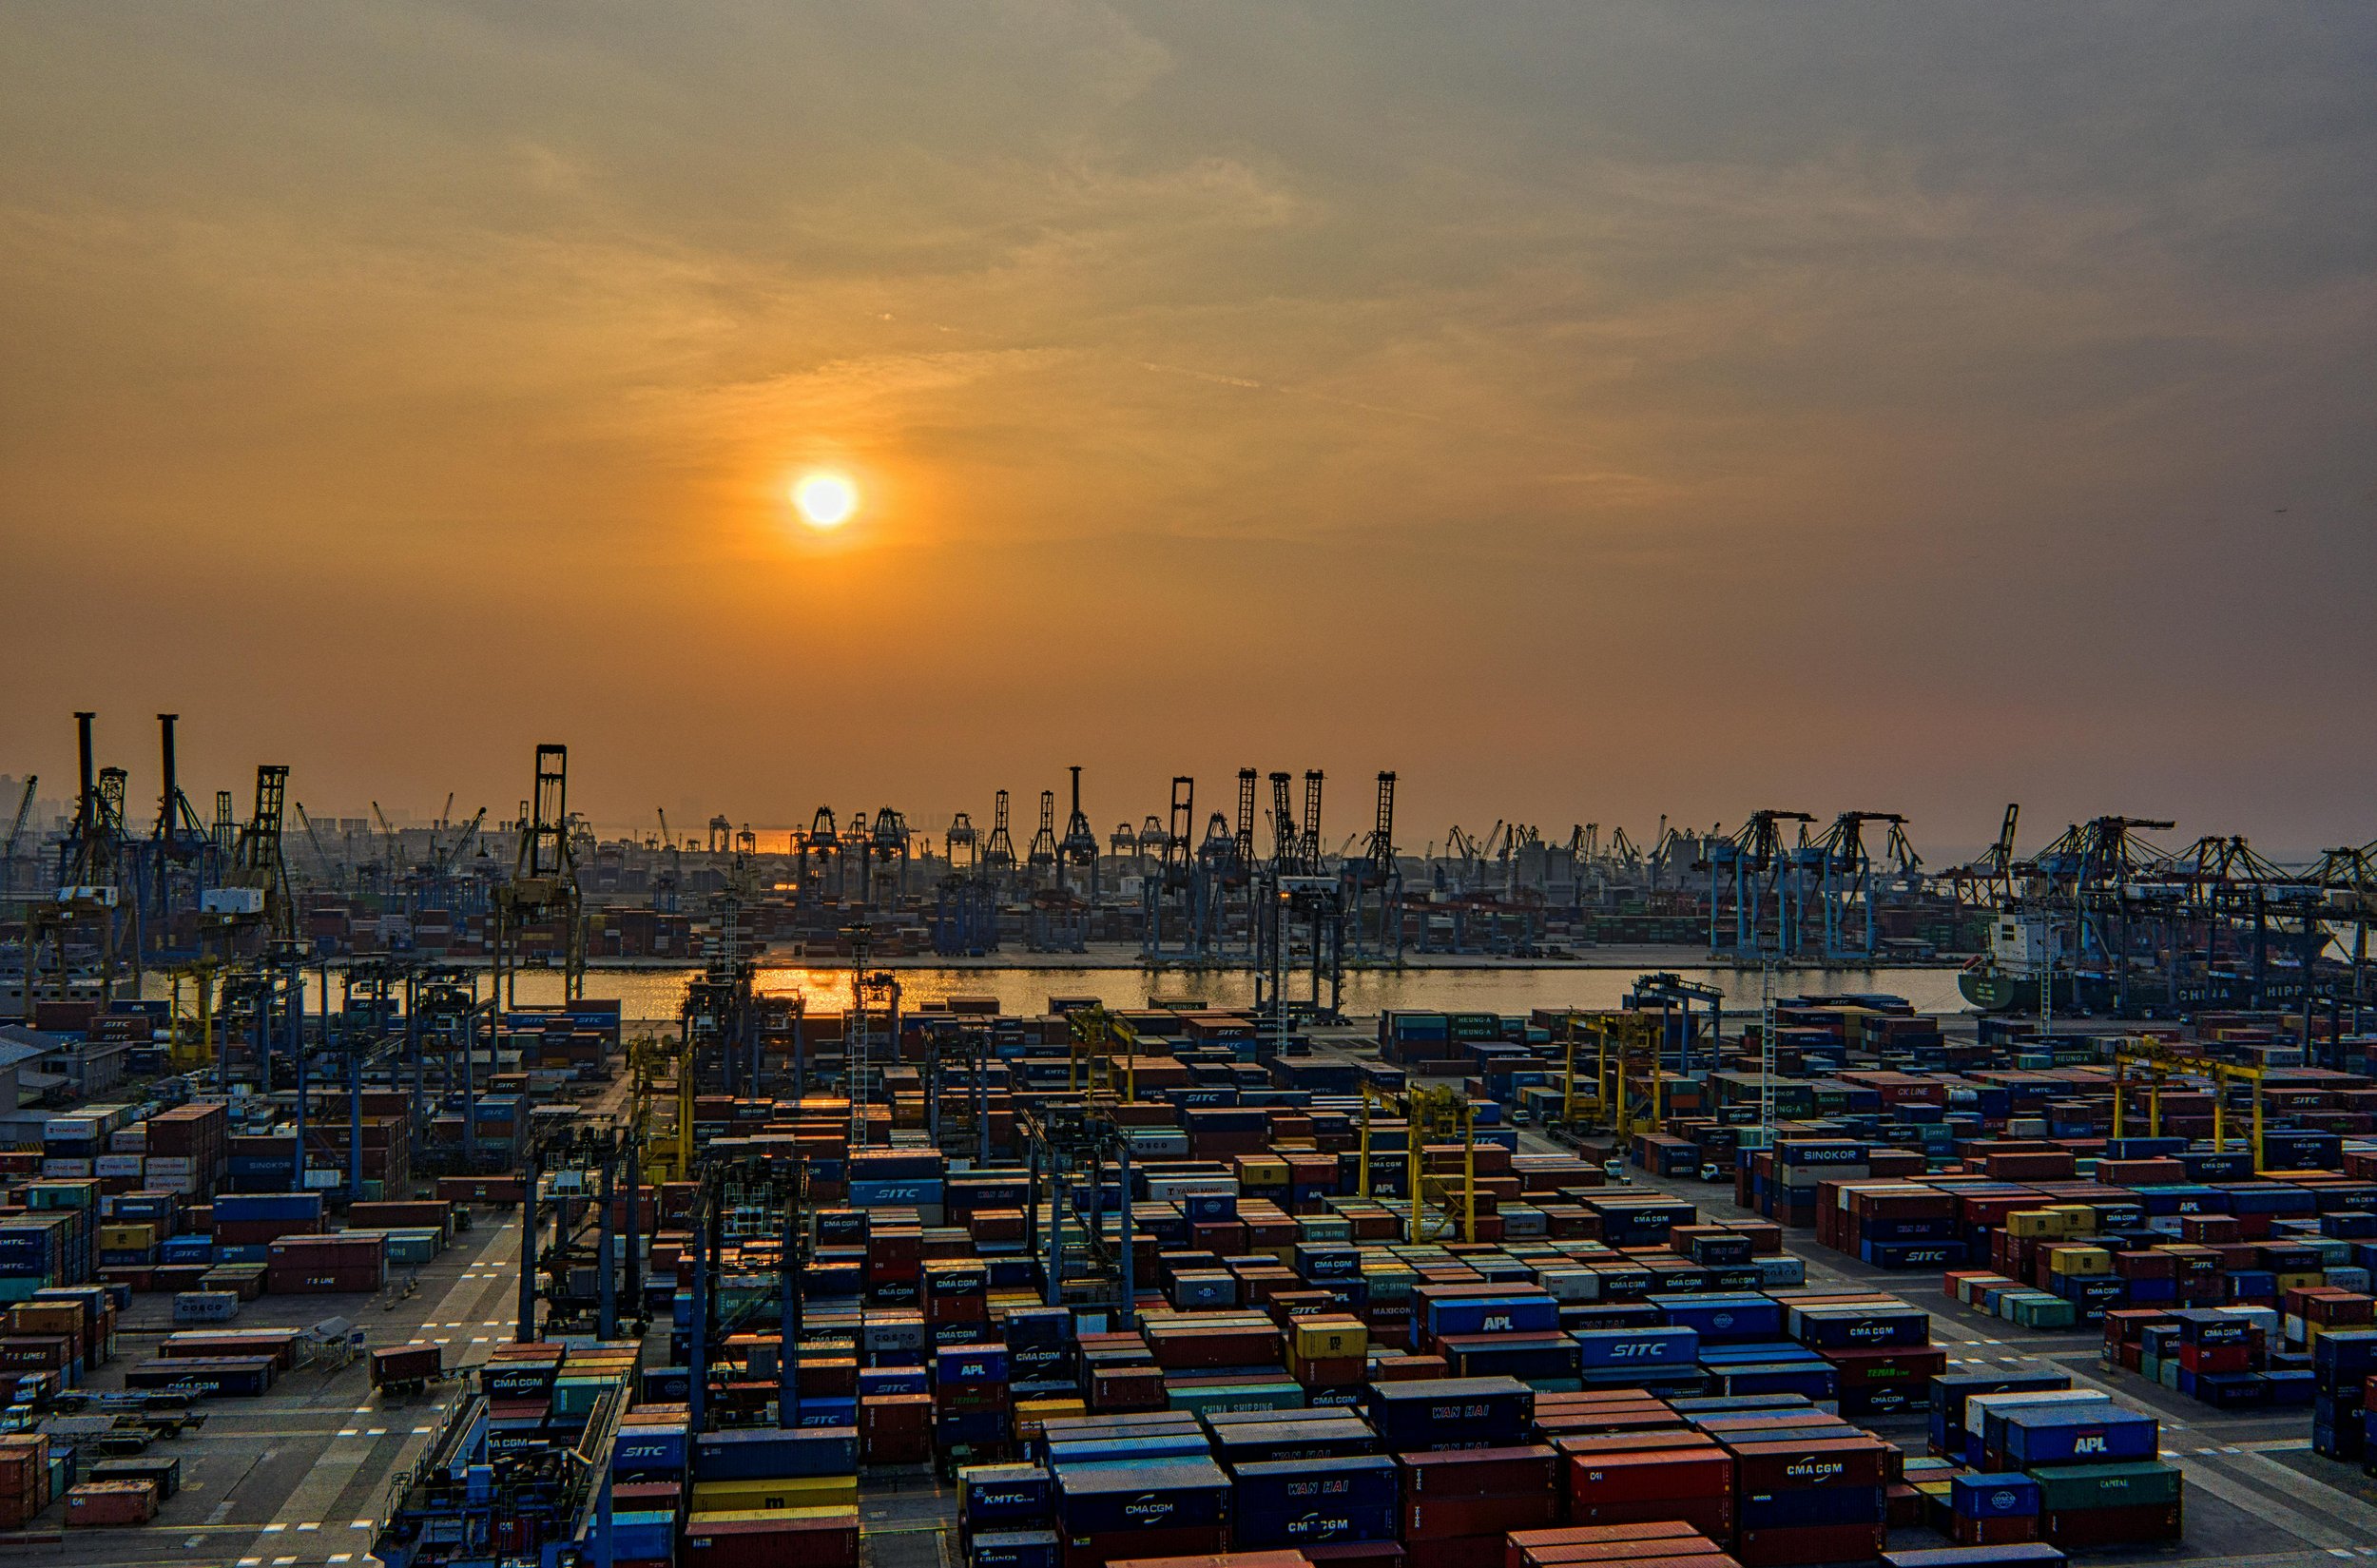


Manifest 2024 served as a reminder of the immense potential that lies ahead in the realm of supply chain technology.