
2023 Economic Trends: A Visual Overview
Auto-payments in reverse!
Auto owners are falling behind on payments at the highest rate on record. The graph illustrates the percentage of borrowers who are at least 60 days late on their car loans.

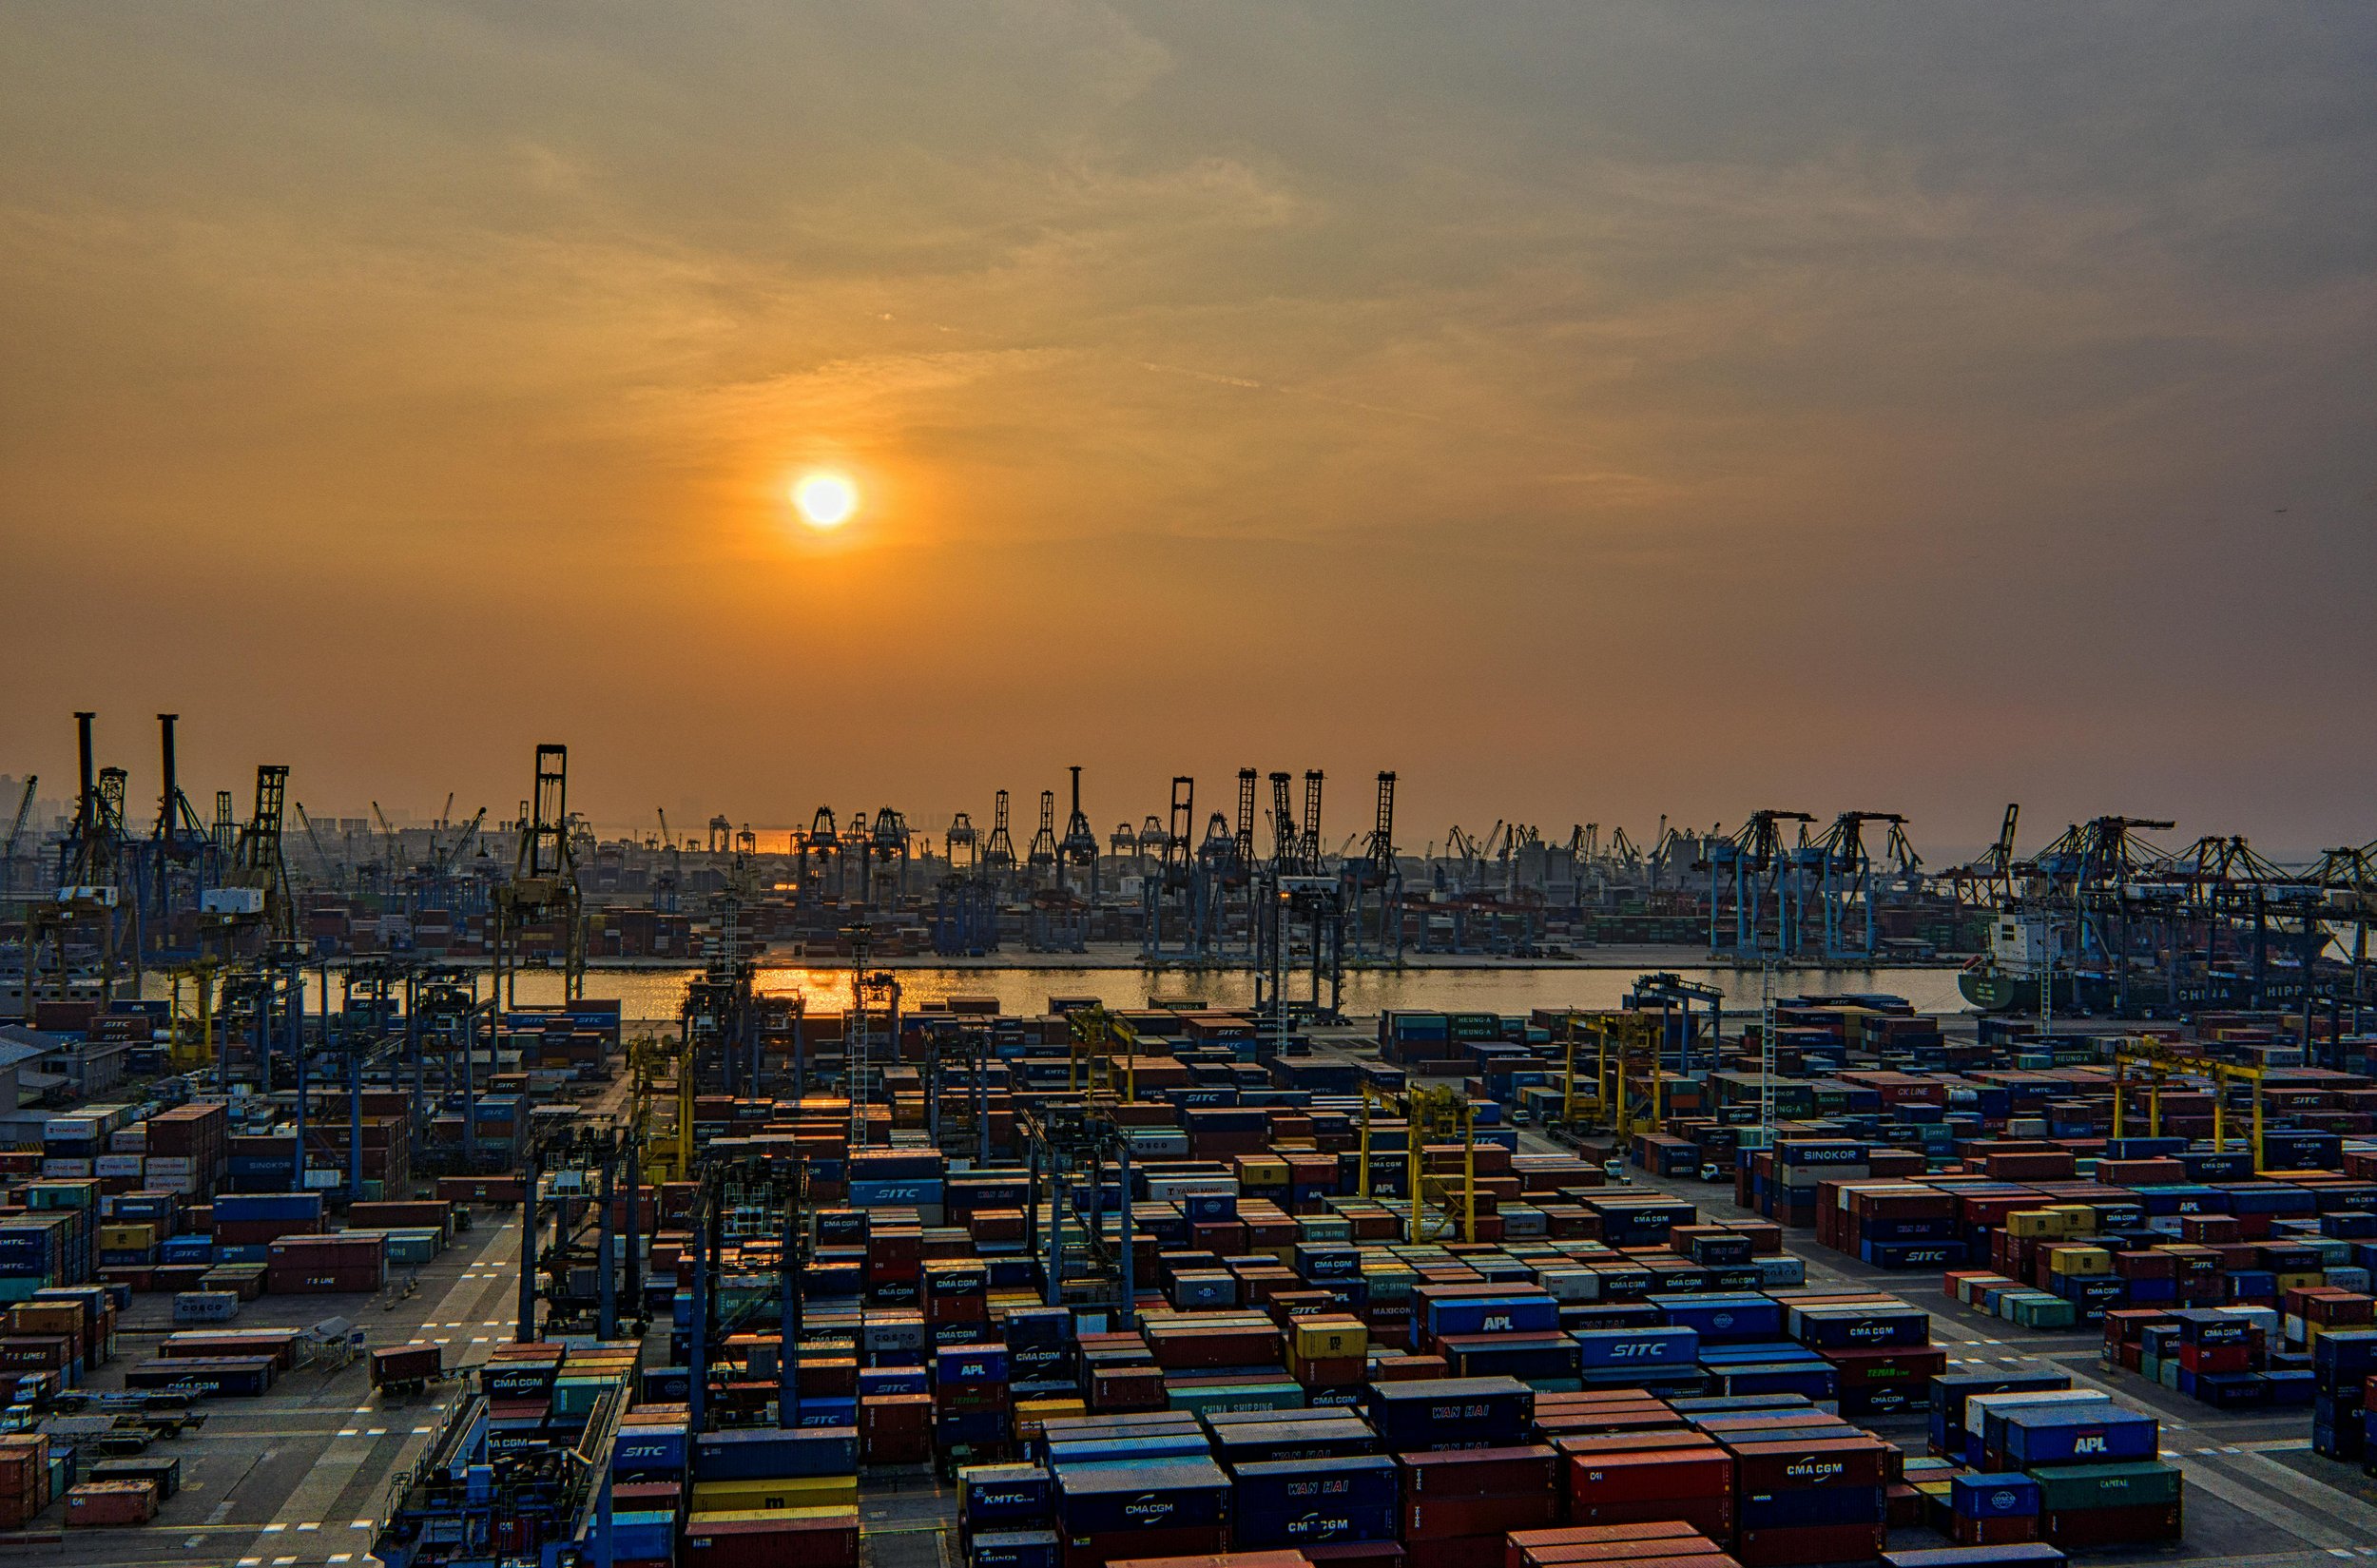
Freighteningly Low Rates
Global container freight rates are now down over 90% from their 2021 peak and, in fact, are at their lowest levels in at least 7 years.

Savings Plunge: Déjà Vu
The U.S. personal savings rate has collapsed, plummeting from its record high in 2020 to levels last seen during the Financial Crisis.

Trucking Overload: White Flag
Truckload volumes (green) are 16% higher than they were in 2018, while trucking authorities (white) have increased by 47% compared to 2018, indicating an excess of capacity.

CEO Payrolls Roll On
Compensation for Trucking CEOs Shifts in 2022

Purchasing Power Time Machine
Private sector wages and salaries, adjusted for inflation, have seen their purchasing power plummet to 2018 levels.

2024 Wage Forecasts: Employee Edition
Projected Pay Increases for 2024 by Industry (Projections for Non-Management Employees).

Freight Market's Downsizing Trend
Month-over-month change in authorized-for-hire carriers shows a continuous shrinkage in the freight market.

Supply Chain Startups Losing Steam
Supply chain management startups are attracting significantly less interest from investors. In 2023, funding has barely surpassed a billion dollars, which is less than one-fifth of the total from the same period last year.

Freightening Costs
As freight demand falls, carrier costs remain high.

There was also been a fall in spot rates.

Shipping to Success
Workforce of the Future by Industry: A Bright Outlook for Transportation and Warehousing.


Workforce Ebb and Flow
The labor force participation rate is declining.

Man-ifest Exit Trends
Men are exiting the workforce at a faster rate than women.

GDP: Growth Returns Strongly
U.S. real GDP growth increased 2.9% YoY, the highest since Q1 2022.

Spending for Knowledge
Ranked by Research and Development Expenditures.

Degrees of Climate Doubt
Skepticism about climate change persists. Education plays a role, but still, fewer than a majority of postgraduates say, 'Climate scientists understand very well whether or not climate change is occurring.


Manifest 2024 served as a reminder of the immense potential that lies ahead in the realm of supply chain technology.