
Charting a Course: Navigating the Latest Trends in the Supply Chain Industry with Charts
ICE, ICE, Baby No More!
We can only speculate about the introduction of EVs and whether they will displace the internal combustion engine (ICE) powered by gasoline and diesel. How long would the transition take place, and will ICEs be phased out altogether?
An intriguing Forbes article offers historical perspective. The authors examined the relationship between the introduction of tractors in agriculture and the number of horses (blue) and mules (orange) used on farms. It took well over 4 decades before horse use dropped by over 50%. The decline in mules followed a similar pattern. The chart also demonstrates a lengthy adaptation by farmers to the new technology. After introduction in early 1900s, tractor use (grey line) crept up rather slowly across several decades.
If tractor adoption in agriculture foreshadows the EV future, ICE appears to be sticking around for a few more decades.


Workers in the accommodation and food services industry organized the most stoppages – 90% of actions led by Starbuck organizers. Notice transportation and warehousing made the top 3 stoppages list. The demands of the vast majority of work stoppage were about insufficient pay.

Navigating the Bumpy Road of Declining Spot Rates
Across the board spot rate declines place significant pressure on small fleets and owner-operators to change their business plans and perhaps leave the industry. This combined with surging operating costs make for difficult decisions ahead.


Boomers vs. Zoomers: Clash of the Ideal Titans
A generation gap? Yes. Clearly, young adults are more likely to report negative views of capitalism than older adults. They are also less likely to be motivated by bonuses or increased salary. Consider how these difference may play out in a workplace.

Container Shipping's Titanic Struggle: Sinking Global Shipment Rates
While container shipment rates from China to the US West Coast have dropped to pre-pandemic levels, an estimated 70% of goods transported by the giant ships do so under contracts – not spot rates. Those contracts were negotiated during 2021 and 2022 when prices were much higher. So the big price drops evident in the chart do not immediately cure inflation. Rather, it will take some time for inflationary pressure to subside as contracts expire and new ones secured. In addition, the chart shows the prices for transport from Europe to US East Coast remain elevated – more than double what they were in 2019.

Ports in a Storm
Top 12 U.S. container ports, ranked by annual TEUs. Port of New York and New Jersey moving up.

Idle Hands on Deck
As trade slows, the number of container ships that sit idle increases. Vessel unused capacity is near a more than two year high.

The Slippery Business of Russian Oil
Russian oil, despite EU embargos, is still finding its way to various buyers around the world. The chart shows that while crude exports to Europe have fallen significantly since Russia invaded Ukraine, the rise in barrels to Asia has compensated for that loss.

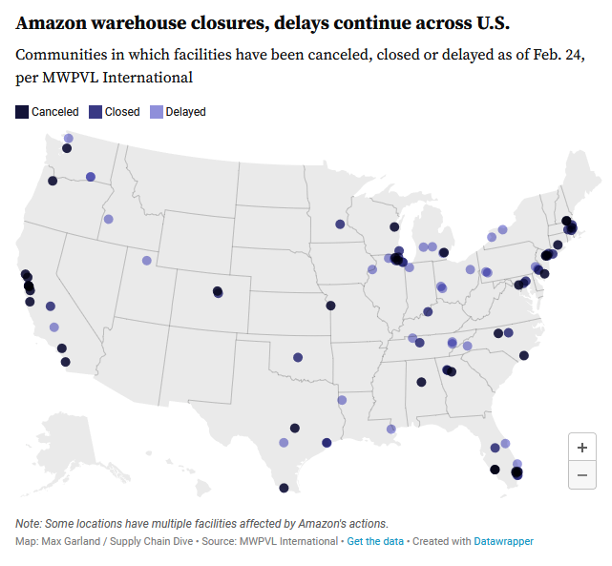
Amazon's Cost-Cutting Crusade
Amazon continues to slash operating expenses, canceling, closing, or delaying 99 warehouse facilities across the U.S. This represents nearly 32.3 million square feet of ground-level space in 30 states.
Amazon and Walmart's Epic Showdown
Share of retail categories: Amazon v. Walmart – last four quarters.

Fear on the Road
A new survey discovered that most Americans are afraid of the advanced vehicle technologies found in modern cars. The percentage afraid increased notably in 2023 to 67% while the percent that trust the technologies declined to only 9%. At a minimum, this suggests the automobile industry should take care to build public trust and educate consumers on the fast paced technological developments.


Manifest 2024 served as a reminder of the immense potential that lies ahead in the realm of supply chain technology.