
A Peek at Today’s Economic Landscape: In Graphs
Generational divide: The Age Rage
A Wall Street Journal poll released last week found that patriotism, having children, religious faith, hard work, and other priorities have declined substantially over the past few decades. Increasingly, people do not consider these important priorities, and this is especially true among the younger cohorts. In addition, fewer younger people share the priorities/values of many older folks: hard work, having children, and religion are very important to older generations but less so among younger ones. This age discrepancy should be considered in discussions about workplace practices and policies.

Institutional distrust
According to a recent AP/NORC poll, the public exhibits little confidence in most of the country’s institutions. A sizeable share of the public expressed a great deal of confidence in the military (37%), but very few in Congress (5%). Banks and financial institutions were next to last at 10%, only 5% ahead of Congress. In the wake of the recent problems in the banking sector, this percentage may be justified.

Toughening banking regulations receives bipartisan support. A majority of both political parties think government regulation of the banking industry is insufficient – there are too few regulations.

The income abyss
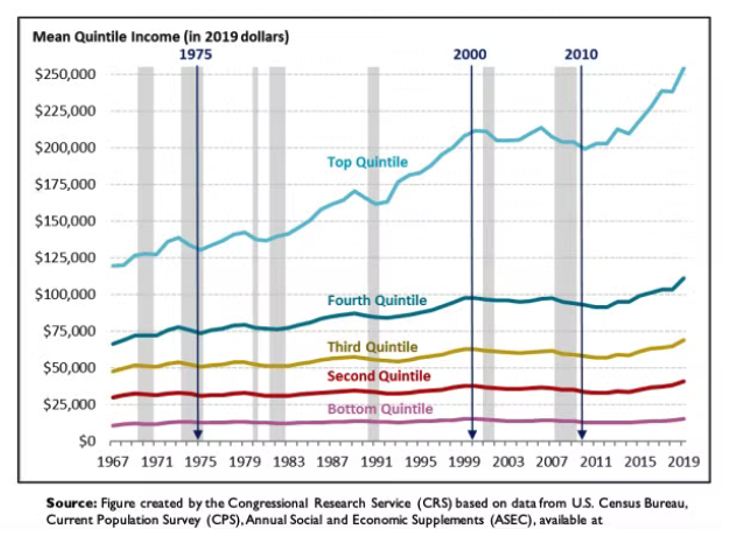
Data from the Congressional Research Service makes it clear that the top household income quintile (20%) has done relatively well over the past few decades. Notice the trends of the other quintiles – they are largely flat.
So, how does this square with talk about growing prosperity in the United States? It is true that prosperity has increased. However, notable growth has only happened in top income groups, producing historically high income inequality.
Mass transit deserted
While many industries have recovered from pandemic disruptions, public transit has not. And many experts think the industry will never recover. This chart shows just how far below pre-pandemic levels public transit ridership remains (in millions).

Truckin' slump
While trucking rates and volumes are down, ACT research expects a correction soon, marking the end of the freight downcycle.

Truckin' sisters
According to the U.S. Bureau of Labor, women now represent about 8% of truck and delivery drivers in the United States. This is up from 5.4% ten years ago.

Job wants vs. boss plots
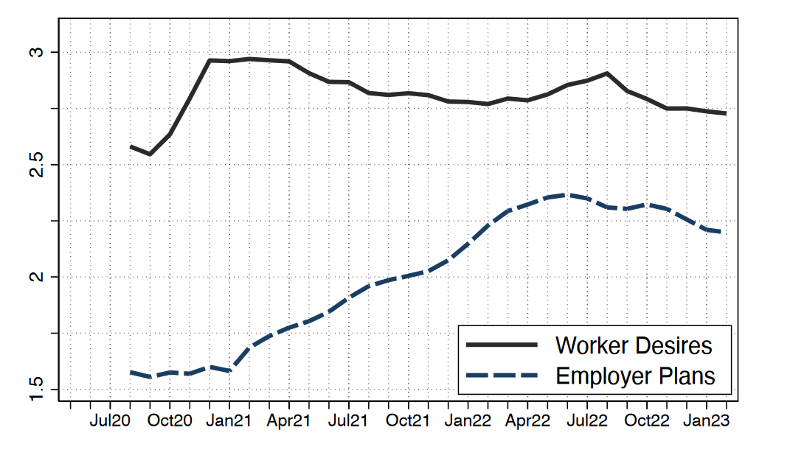
In a study of over 100,000 employees who have work-from-home experiences, employees were asked two questions:
1. As the pandemic ends, how often would you like to have full paid days at home? (worker desire)
2. As the pandemic ends, how often is your employer planning for you to work full days at home? (employer plans)
The gap between worker desires and employers' plans is large (about a day in 2023), but over the past two years, the gap is closing.
Zooming ahead: city slickers
As with many other things in the United States, there is a large work from home experience gap between rural and urban populations.

Traffic jammed?
In the transportation/warehouse sector, average days per week worked from home is relatively small compared to other industries.

Delivering returns
Last mile market outlook appears bullish.

And last mile cost of delivery – 53%.


Manifest 2024 served as a reminder of the immense potential that lies ahead in the realm of supply chain technology.